cfDNA Quality Control#
The qc command has one table-assembly step and three cfDNA feature checks.
QC metrics and scores Parses process reports into
qc_summary.tsvandqc_scores.tsv. Run fragment-length step 2 first when the summary should include median fragment length.Methylation distribution Uses the merged CpG matrix to plot cohort methylation beta-value densities. Interpret this with coverage, M-bias, assay information, and an independently validated conversion control when required; its shape alone is not a sample-quality verdict. Default CFTK processing does not generate CHH/CHG-derived conversion metrics.
Fragment length distribution Uses duplicate-marked BAMs and deepTools
bamPEFragmentSizeto write raw lengths, per-sample histograms, and a combined cohort plot.Dinucleotide frequency Requires the reference FASTA and configured fragment settings. This expensive stage is opt-in for
cftk run.
cftk --config cftk_init.json qc -s 2 0 1
The beginner workflow uses that order by default. Add step 3 explicitly when needed:
cftk --config cftk_init.json qc -s 3
Expected Output Location#
QC outputs are written under:
<output_dir>/results/2_qc/
Expected Outputs#
Step |
Output location |
Files to inspect |
|---|---|---|
|
|
|
|
|
|
|
|
|
|
|
per-motif intermediate tables plus |
The first three visuals below are sanitized observed technical outputs from the documented two-sample example run. The dinucleotide panel is a fixed-seed synthetic illustration because no public-safe QC-step-3 run artifact is available. None of these panels defines a user-facing pass/fail threshold.
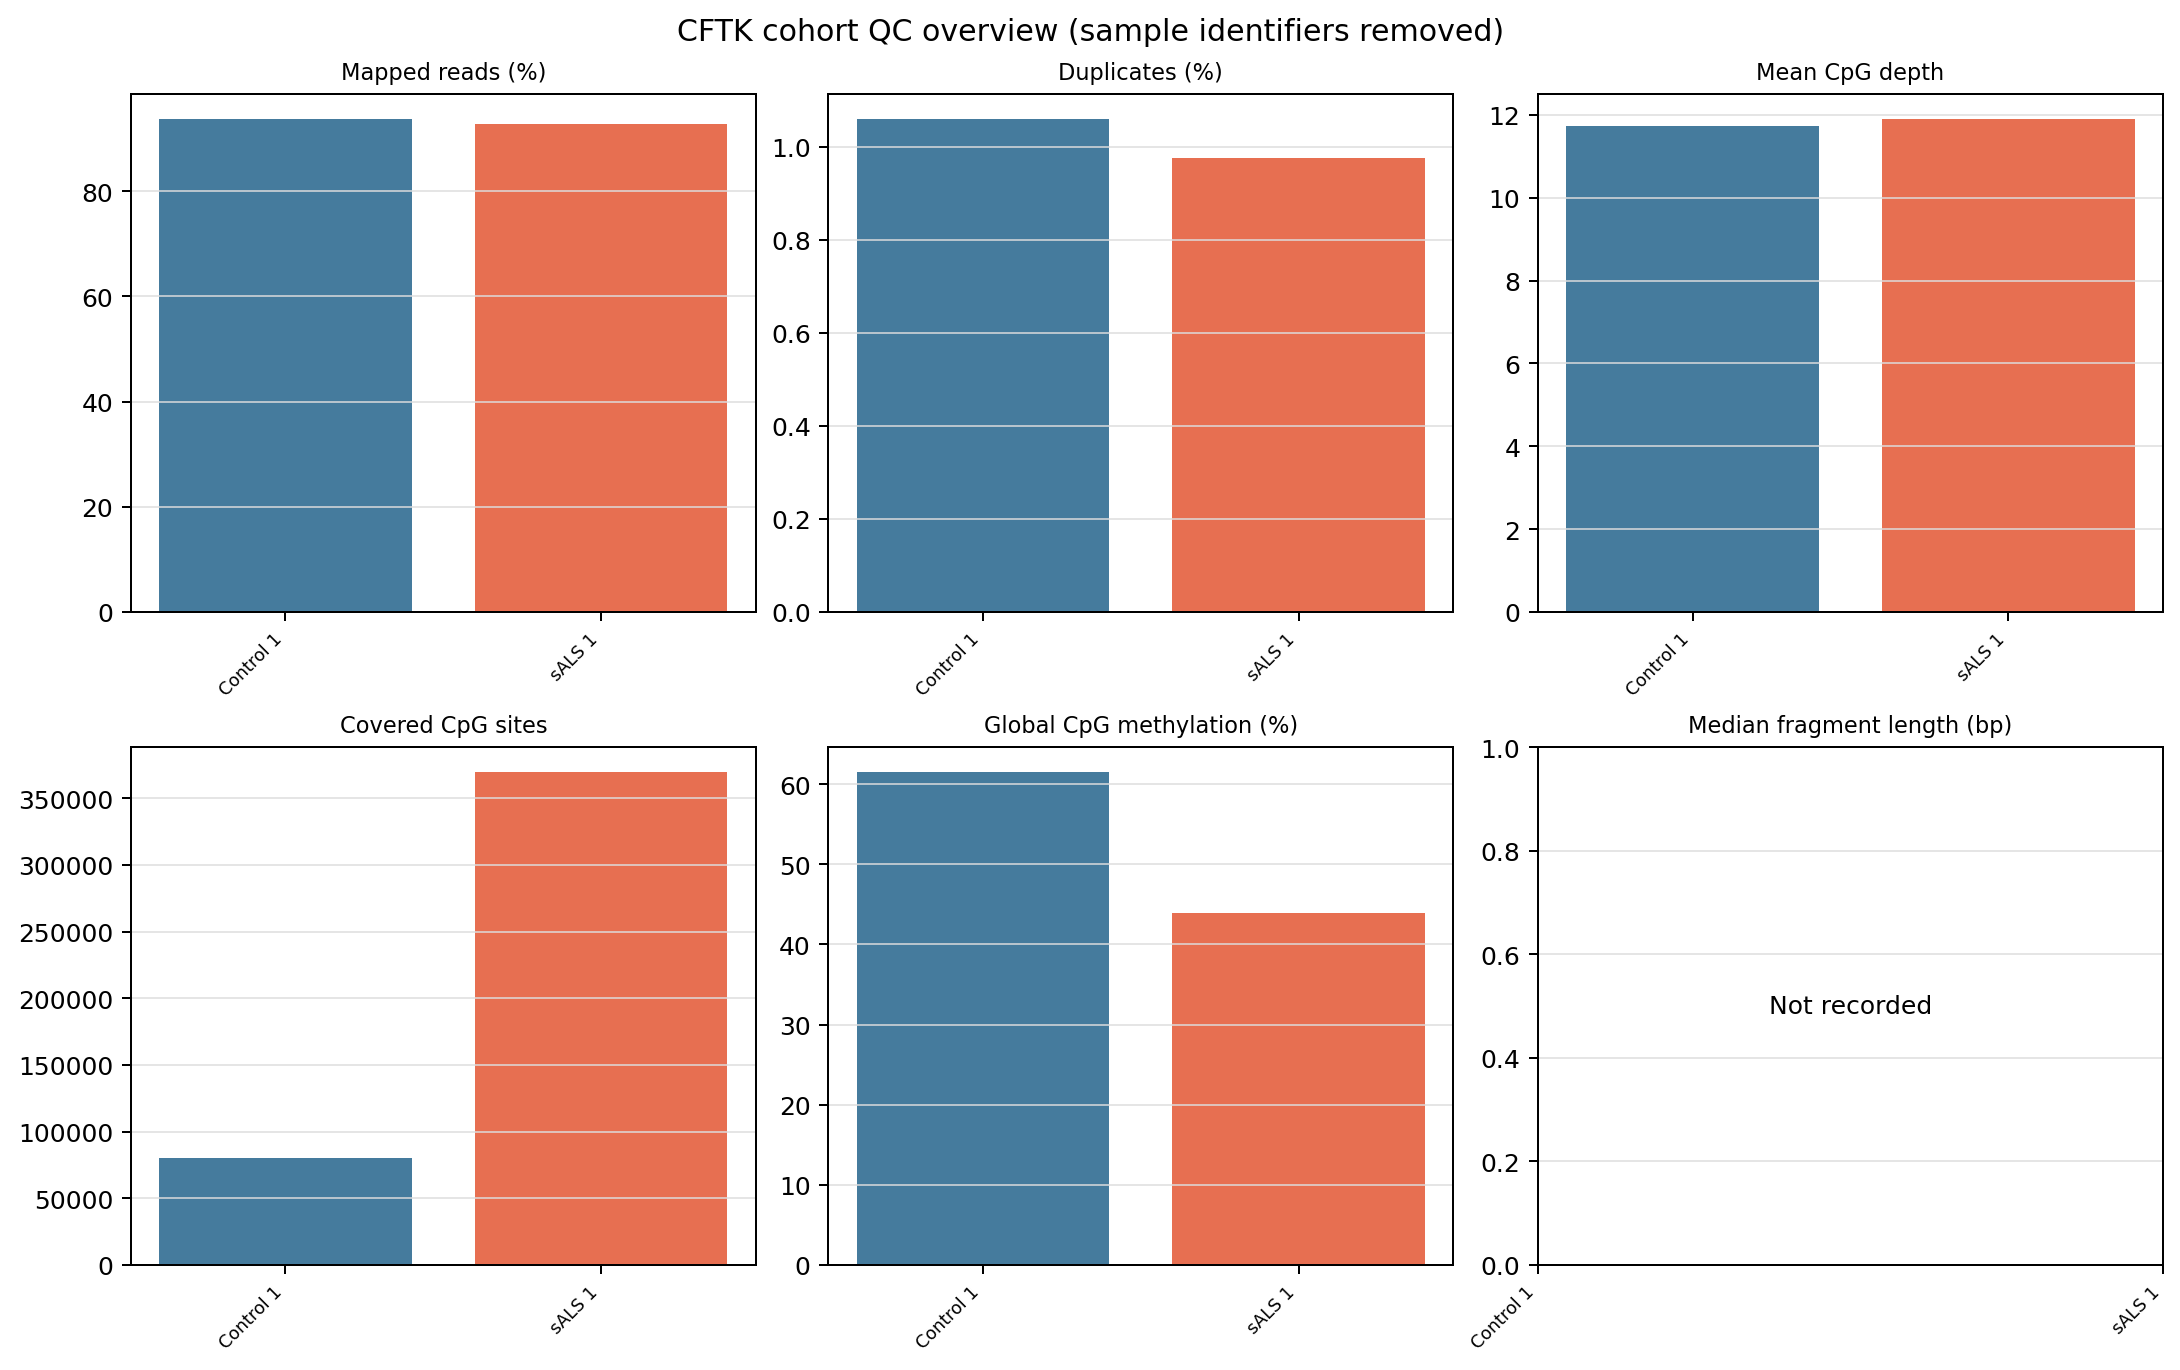
qc.0 is table-first. This sanitized overview is a rendering of the
summary metrics and is useful for orientation; the TSV files remain the
authoritative machine-readable outputs.#
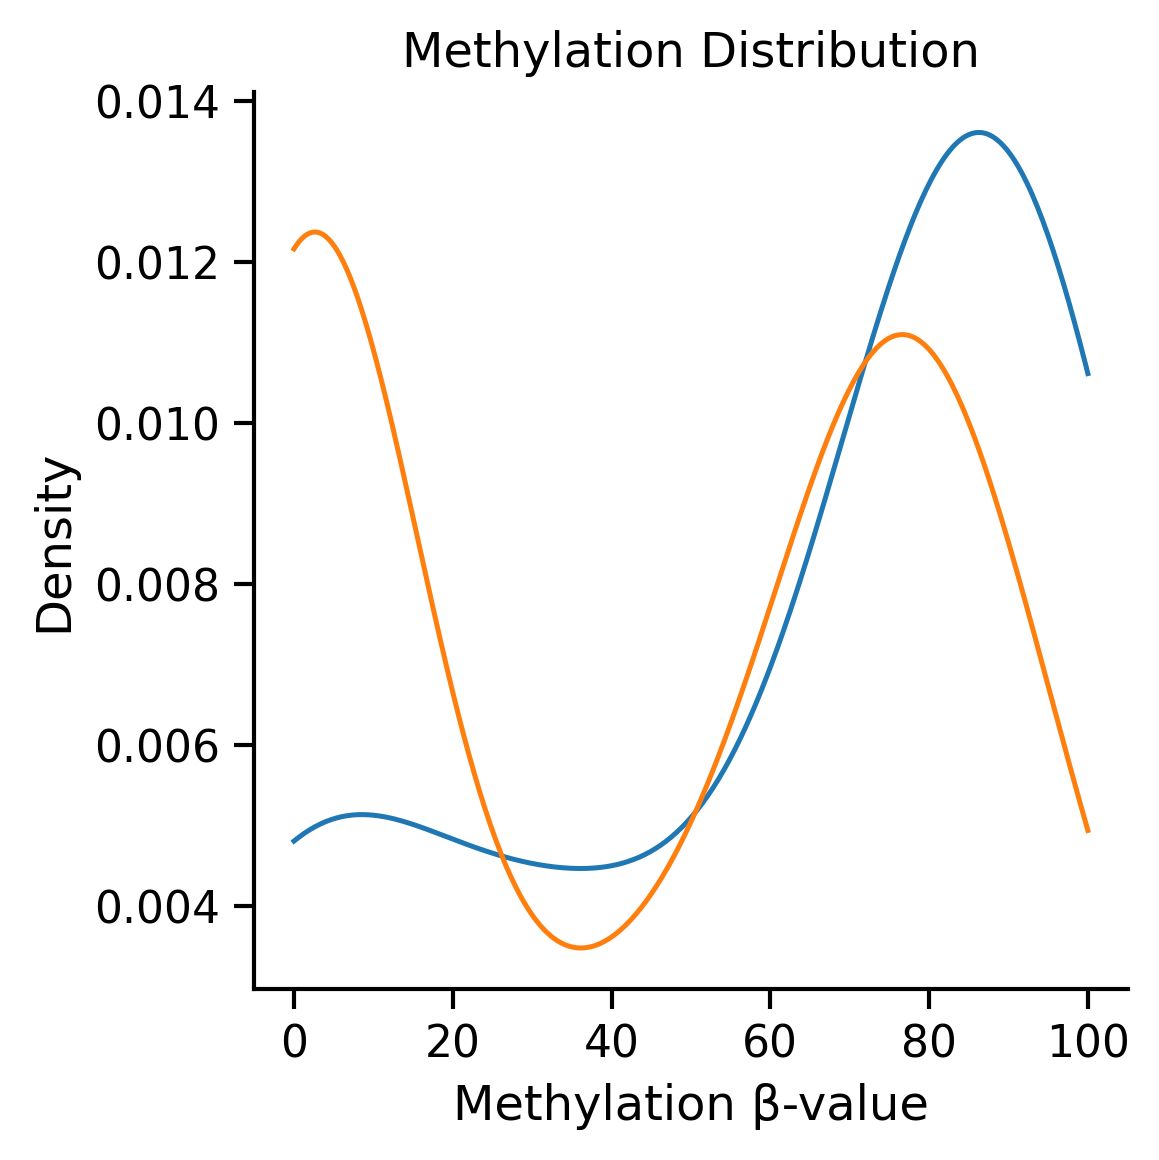
qc.1 reads the merged CpG matrix and writes the methylation-distribution
PNG/PDF. The curve must be interpreted with depth, M-bias, and any
available independently validated conversion-control evidence.#
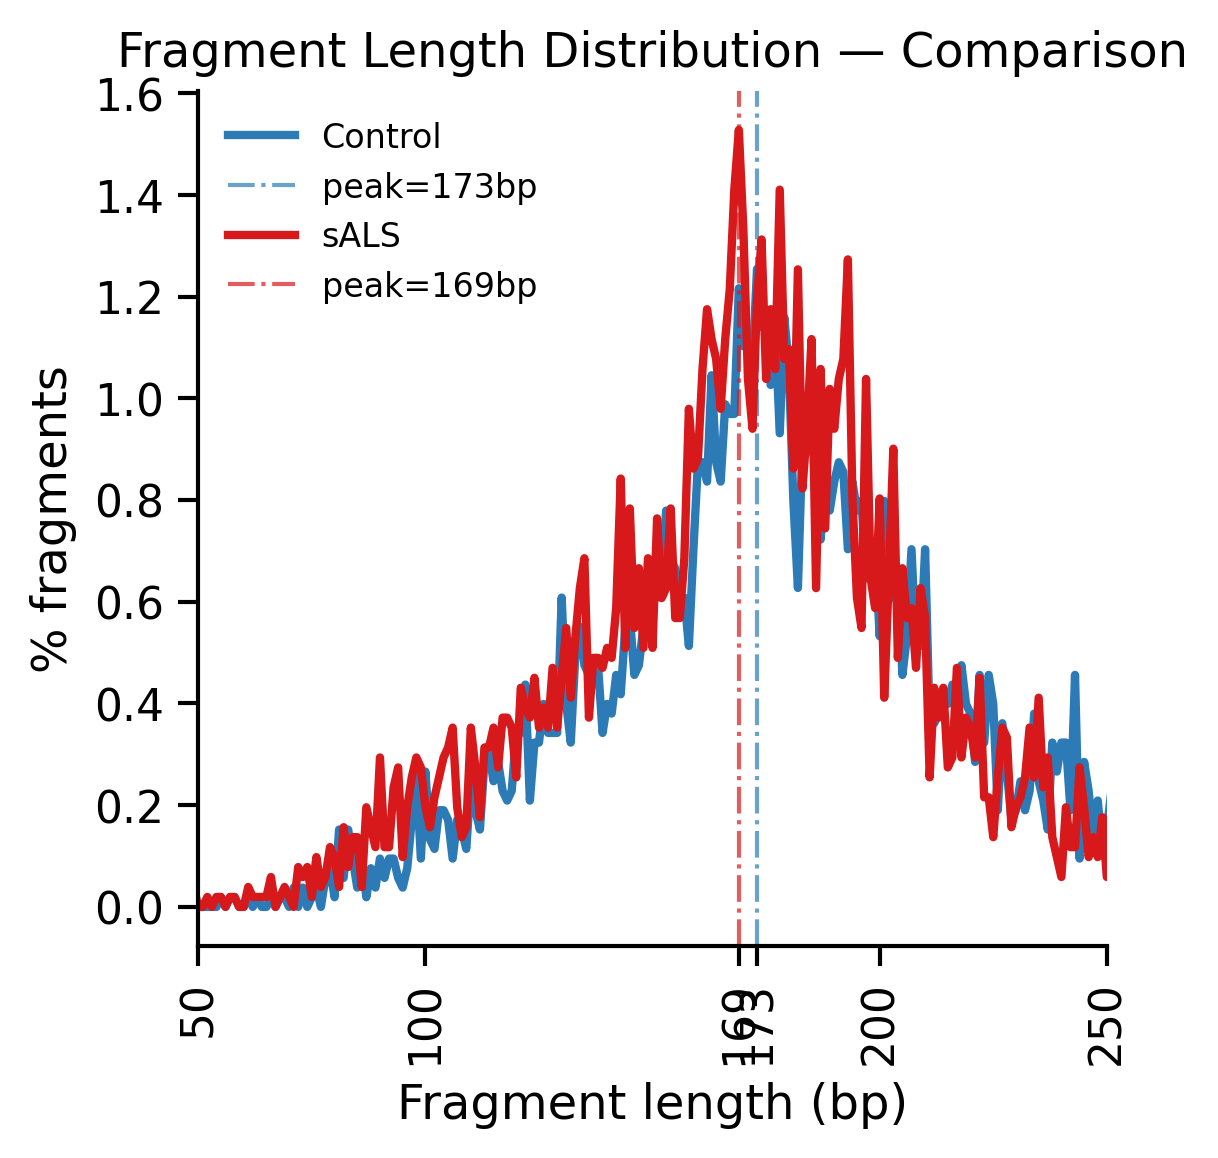
qc.2 writes raw fragment-length tables and per-sample/combined plots.
The two curves are examples, not group-level inference.#
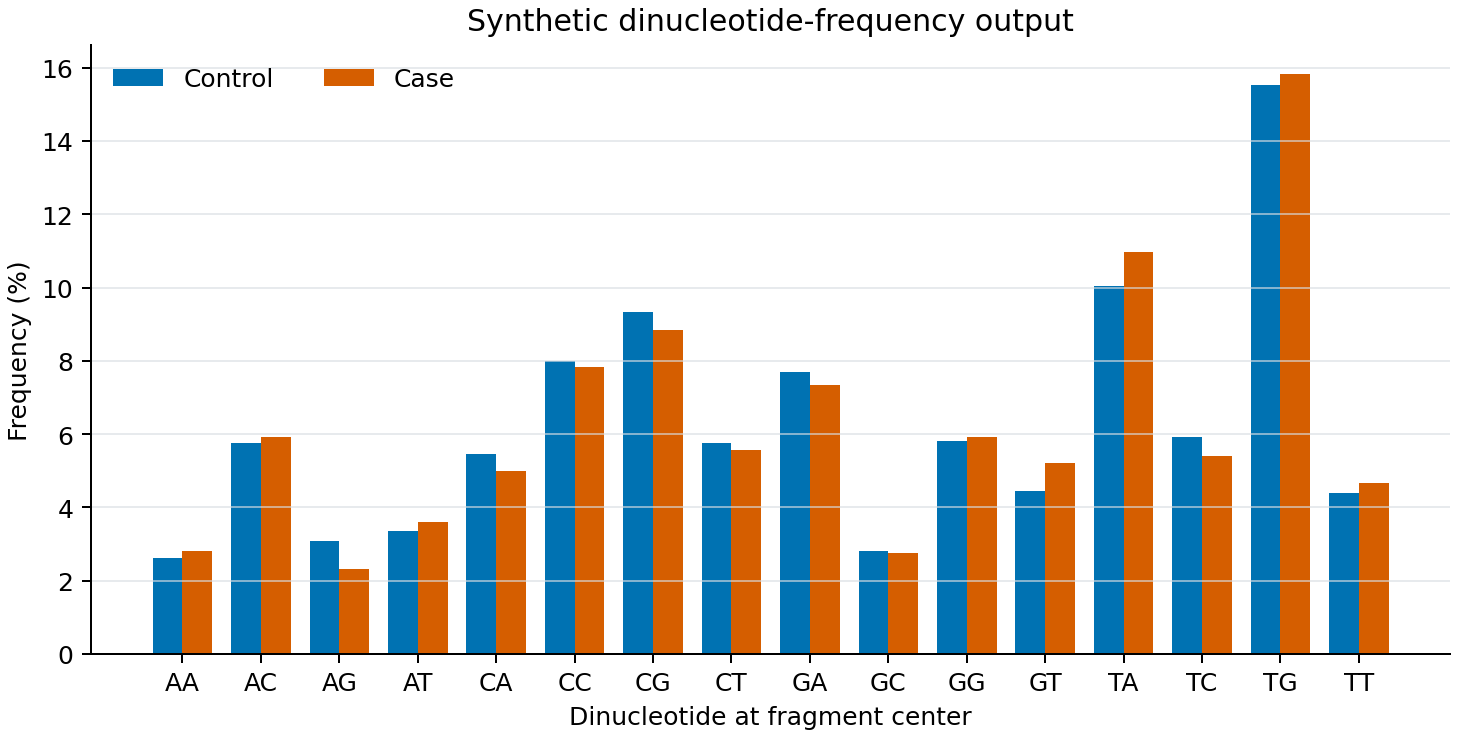
Synthetic, fixed-seed illustration of the shape of a qc.3 dinucleotide
output. It contains no human-derived measurements and is not validation
evidence.#