Model-Development Power Calculator#
The CFTK model-development power calculator evaluates whether a proposed liquid-biopsy biomarker-discovery cohort is likely to produce a useful and detectable internally cross-validated classifier.
The calculator reports three distinct operating characteristics. They answer different questions and should not be used interchangeably.
Power Definitions#
Detection power#
detection_power is the probability that a simulated study rejects the
no-discrimination null at the fixed significance level alpha = 0.05.
For every sample size, CpG template, model, and sequencing depth, CFTK creates a matched no-signal template in which case and control methylation distributions are identical. It then reruns the complete cross-validation pipeline on these null cohorts. For an observed out-of-fold AUC, the empirical upper-tail p-value is calculated as:
where \(B_{null}\) is the number of null simulations for that CpG template.
Detection succeeds when p <= 0.05.
Target-attainment probability#
target_attainment_probability is:
It answers whether the internally cross-validated classifier reaches the prespecified performance target, regardless of whether the observed AUC is statistically significant against the null distribution.
Probability of success#
probability_of_success is the conservative joint criterion:
A simulated study counts as successful only when it both detects
a departure from no discrimination and reaches the target AUC. Therefore,
probability_of_success cannot exceed either detection_power or
target_attainment_probability. This is the default plot in the web app.
Confidence intervals are uncertainty summaries around these metrics. A lower confidence bound is not a separate definition of power.
Discovery Workflow#
Each simulated study uses the total cohort sample size entered in the app. The samples are split with stratified cross-validation. Within every training fold, CFTK applies the full biomarker-discovery workflow:
training-fold-only missingness filtering;
training-fold-only median imputation;
zero-variance filtering;
training-fold-only ANOVA F ranking;
fixed top-k CpG selection;
training-fold-only standardization;
logistic-regression fitting;
held-out-fold prediction;
combined out-of-fold AUC calculation.
All preprocessing, feature ranking, feature selection, scaling, and model fitting are repeated inside each training fold. The same complete workflow is used for signal studies and null-calibration studies. The public calculator uses logistic regression as a fixed model-development pipeline.
Null Calibration#
The null calibration preserves:
the sampled CpGs and their baseline methylation means;
depth-dependent CpG variance and missingness;
within-block feature correlation;
sample size and case-to-control ratio;
CV folds, filtering, imputation, feature ranking, feature selection, and classifier settings.
Only the case-control biological effect is removed. This full-pipeline null is preferred to applying an ordinary independent-sample ROC p-value directly to pooled out-of-fold predictions, because CV predictions arise from overlapping training sets.
Fast mode uses 20 null simulations per CpG template. At alpha = 0.05, this
is the minimum practical empirical tail calibration and is intentionally
coarse. Standard mode uses 30 null simulations per template and reduces Monte
Carlo noise, but it remains a web-oriented approximation. Larger offline
analyses should use substantially more null simulations when precise tail
probabilities are required.
User-Adjustable Assumptions#
The app exposes study-design settings for total sample sizes, case-to-control ratio, mean sequencing depth, and target cross-validated AUC. Biomarker assumptions include the number of candidate CpGs, number of true signal CpGs, mean absolute methylation difference, and selected CpGs per fold.
Advanced settings control effect-size variability, effect direction, within-block correlation, cross-validation folds, minimum observed fraction, the specificity operating point for descriptive sensitivity reporting, and the empirical SD uncertainty scenario. Lower SD estimates are generally more optimistic, while upper SD estimates are generally more conservative.
Sequencing depth enters through empirical CpG variance and missingness patterns derived from aggregate reference arrays stored in the GitHub repository. The Python distribution does not bundle these arrays. The Streamlit deployment loads them from its repository checkout, and the calculator does not use or expose patient-level data.
Interpreting Additional Outputs#
mean_cv_auc summarizes the average out-of-fold AUC across signal studies.
mean_null_auc_threshold summarizes the template-specific upper 5% null AUC
thresholds. Sensitivity at the selected specificity is a secondary descriptive
operating-point metric and does not define any of the three power metrics.
Feature recall and precision are simulation diagnostics because the simulated true signal CpGs are known. Selection Jaccard summarizes fold-to-fold feature-set overlap and can help identify unstable feature selection in small or noisy designs.
These outputs evaluate internal model-development adequacy. They do not estimate external cohort performance, and independent validation remains necessary before claims of clinical generalizability.
Run The App Locally#
Clone the repository, install the web extra, and start Streamlit from the repository root:
git clone https://github.com/ChaorongC/CFTK.git
cd CFTK
python -m pip install ".[web]"
streamlit run apps/model_power_calculator.py
The checkout must contain data/manifest.json and its companion arrays.
The app uses those repository-local files and does not download reference data
at runtime. Streamlit prints the local browser URL after startup, normally
http://localhost:8501.
Hosted Deployment#
A public calculator URL is not currently advertised because the configured Streamlit deployment requires platform authentication. When a deployment is made accessible without authentication, add its public URL to this page and the repository README before embedding it in the documentation.
Reproducibility#
The app provides downloads for the power curve, signal-study replicates, null-calibration replicates, and a settings JSON file. The settings export includes user inputs, the selected power definition, null-simulation count, precision mode, deterministic seeds, and fixed computation settings needed to reproduce the calculation.
Expected Outputs#
Each completed calculator run can be downloaded directly from the app:
cftk_model_power_curve.csv
cftk_model_power_signal_replicates.csv
cftk_model_power_null_replicates.csv
cftk_model_power_settings.json
The curve preview below is a fixed-seed synthetic example of the three metrics shown by the calculator. It is included to make the output contract visible before a beginner launches Streamlit; it is not generated from the repository reference arrays and is not evidence for any proposed sample size.
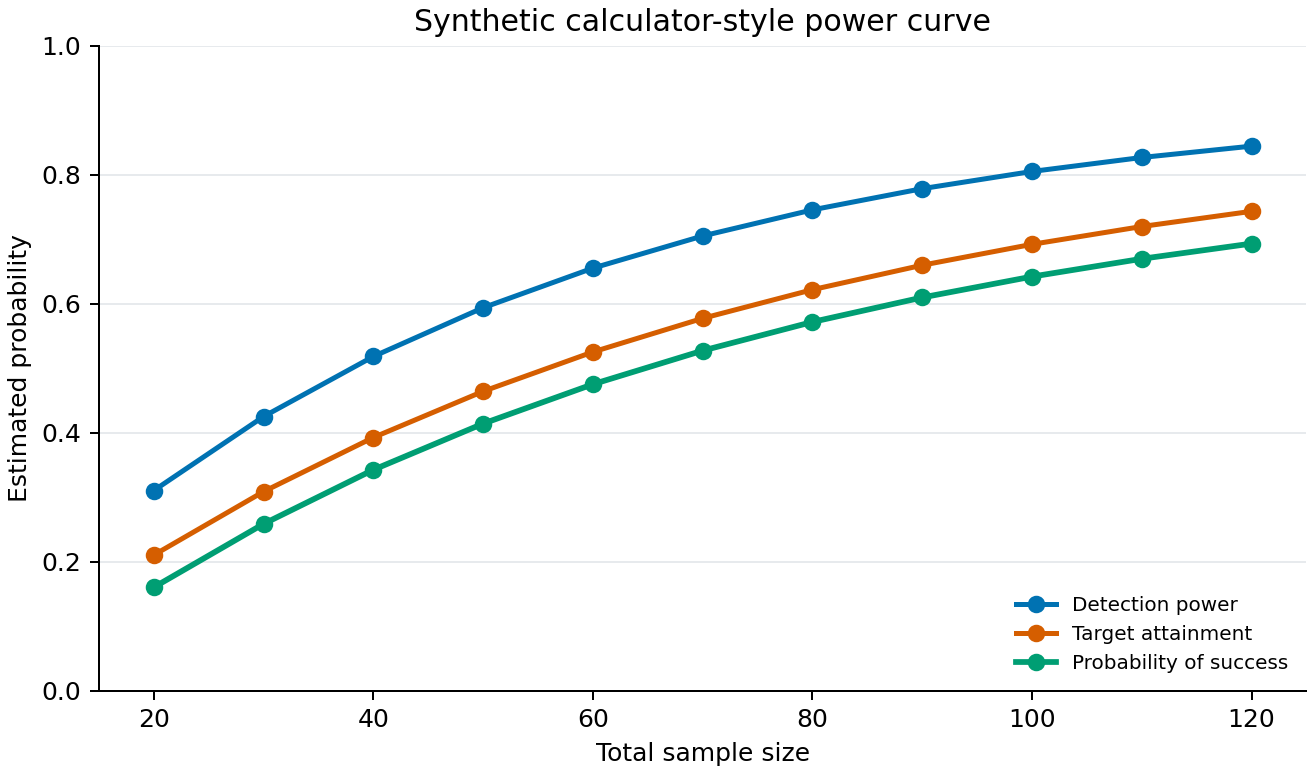
Synthetic illustrative calculator output: detection power, target attainment, and their joint probability of success are distinct curves.#